
Instagram Insights Made Simple: Track Your Social Media Growth
Key Takeaways
- Instagram Insights is a free, built-in tool inside the Instagram app that shows who is seeing and enjoying your posts, Reels, and Stories – no extra software needed.
- You must switch from a personal account to a professional account (Creator or Business) to see Instagram analytics, but this change is free and you can still use Instagram the same way you always have.
- The most helpful key metrics for beginners and hobby creators are accounts reached, accounts engaged, engagement rate, audience demographics, and followers’ active times.
- You can choose a date range – such as “last 7 days” or “last 30 days” – to see how your content strategy is doing over time, rather than worrying about one single post.
- You don’t need to be a tech expert or marketer. Insights is simply a way to understand what people enjoy so you can share more of it and connect better.

Introduction: Why Instagram Insights Matter for Your Creator Journey
Many people now use Instagram to share crafts, travel memories, gardening progress, or family updates – and naturally want more people to see and enjoy those posts. That’s exactly where understanding Instagram insights comes in.
Instagram Insights is a built-in analytics tool for professional accounts that turns your content’s performance into simple numbers and charts. Think of the insights overview as a friendly report card that shows what topics people like, which photos or videos get the most reactions, and what times of day work best. Instead of guessing what to post next, you get a gentle guide.
Instagram keeps adding new available insights in 2025–2026, but the basics – reach, engagement, followers, demographics – have stayed the same and are more than enough for any beginner. This article will walk you through everything step by step, from opening Insights to reading the main tabs to checking an individual post, always with beginners in mind.
Setting Up: How to Unlock Instagram Insights in the Instagram App
This is a one-time setup. It does not cost money and does not force you to “become a business.”
Instagram Insights is available for professional accounts only. A personal account does not show analytics. To switch to a professional account and unlock Instagram Insights, follow these steps:
- Open the Instagram app on your phone.
- Tap your Instagram profile picture in the bottom right.
- Tap the three-line menu in the top right.
- Go to Account type and tools.
- Select Switch to professional account, then choose Creator.
Pick a category that fits you – “Blogger,” “Artist,” “Photographer,” or “Writer,” for example. This mainly helps Instagram understand what you share; it doesn’t lock you in. A creator account gives you all the professional tools you need without any fees.
After switching, you’ll see a professional dashboard banner on your profile. This is where you access Insights by tapping “Insights.” You can also view account settings anytime through the same menu.
One thing to know: your Instagram account must be a public account to use Insights. Private profiles cannot access analytics. Also, Insights will only show data for content posted after the switch, so new posts will give you clearer numbers than very old ones. These are truly free insights – no payment required, and you can switch back anytime.
Insights Overview: Your Home Base for Instagram Analytics
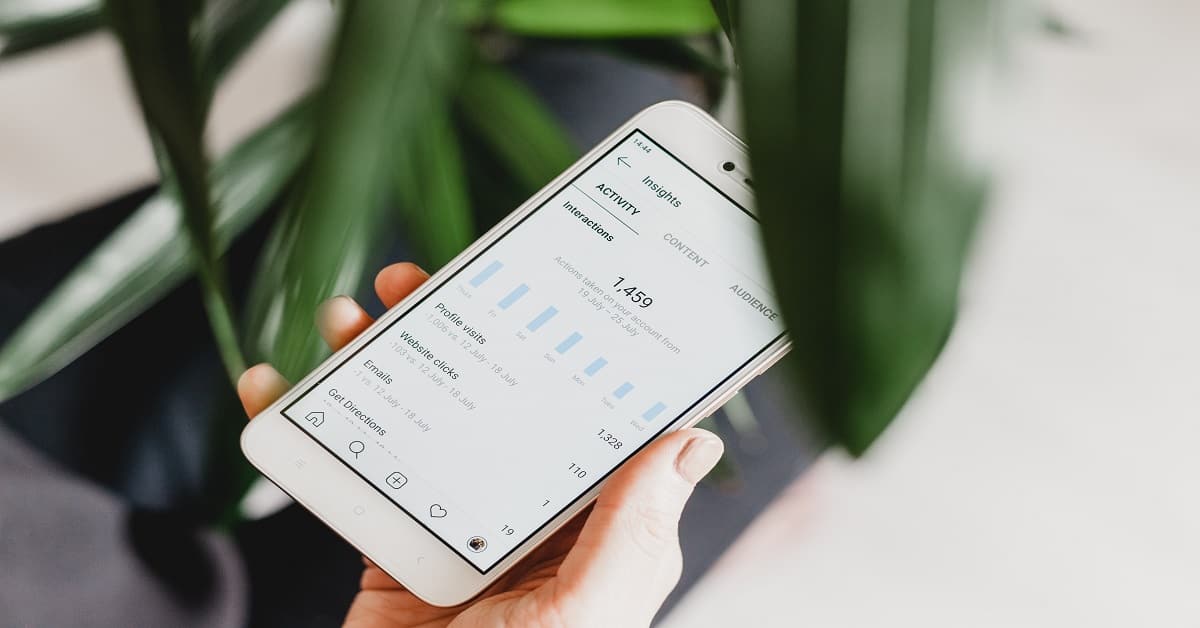
The insights overview screen is the main page that appears when you tap “Insights” from your profile or professional dashboard. Think of it as your home base.
This overview usually shows:
- Accounts reached in your chosen date range – how many different people saw your Instagram content.
- Accounts engaged – people who liked, commented, shared, or saved.
- Follower changes – how many new followers you gained, minus any who unfollowed. Total followers insights show growth trends and demographics over time.
- A list of content you shared (posts, stories, reels, and sometimes Instagram Live videos) during that time frame.
Instagram Insights tracks account performance and audience demographics, and it enables the measurement of overall account growth right from this screen. The content insights overviews also include metrics like views and interactions, giving you valuable data at a glance.
To change the date range, tap the dropdown menu at the top. You’ll see options like “Last 7 days,” “Last 30 days,” or “Last 90 days,” as well as a preset or custom timeframe option. For beginners, checking monthly is a great starting point.
Think of this overview as a gentle “health check” for your creator journey, not a test you can pass or fail. From here you can tap into deeper sections for more detailed metrics.
Understanding Reach and Accounts Engaged: Key Instagram Metrics
Reach and engagement are the two most important ideas for seeing how far your posts travel and how strongly people react.
Accounts reached tells you how many unique accounts – different people – saw at least one of your posts, Reels, or Stories in the selected date range. Reach measures unique accounts that see your content, so even if the same accounts viewed your photo five times, they count as one. This number includes both followers and non followers, which matters if you want to meet new people or grow your audience.
Accounts engaged shows the people who actually did something with your content. Accounts engaged are unique accounts that interacted with content – interactions include likes, comments, saves, and shares. This number is usually smaller than reach, but it reveals who truly cared enough to respond. When you look at the accounts engaged data, you’ll see it broken down by content type, which helps you spot what’s working.
The accounts engaged metric broken down this way lets you compare, say, a gardening Reel against a text-only post. You might find that Reels reach many non followers and spark far more interactions accounts than a simple photo.
Now, about engagement rate: it compares how many people interacted with your content versus how many saw it. For many small hobby accounts, a good engagement rate is around 2% to 5%, and higher is a nice bonus, not a requirement. Viewers are unique accounts that saw content at least once, while views count total times content is displayed, including repeats – those multiple views from the same person are called impressions.
Audience Demographics and Active Times: Who Sees You and When
Instagram Insights provides audience demographics for better targeting – even if your “target” is simply the right group of fellow hobbyists. You can view audience demographics by tapping the “Total followers” section in your insights overview.
Here’s what you’ll find:
- Top locations: countries and sometimes cities (like “United States,” “Canada,” or “London”).
- Age range: groups such as 18–24, 25–34, 35–44, 45–54, 55–64, and 65+. The followers age range times data helps you understand who’s watching.
- Gender breakdown: where available.
- Active times: graphs showing when followers are usually online, by hour and by day.
The Audience tab in Insights details follower demographics and active hours, so you can see exactly when your people are scrolling. Understanding audience behavior can tailor content and posting strategies considerably. Effective posting times can be optimized based on audience activity data – try posting 30–60 minutes before peak active times so your posts sit near the top of followers’ feeds.
Here’s a practical example: if most of your followers live in the UK and are most active around 8 pm their time, and you’re a crafter in Florida, you might choose to post mid-afternoon Eastern Time to match that audience.
All this viewers data is anonymous; you can’t see exactly who someone is, only groups. That protects everyone’s privacy while still guiding your content strategy.

Checking an Individual Post, Reel, or Story
Once you understand the overview, the next step is looking at insights for individual posts, Reels, or Stories to see what specifically worked. Instagram Insights measures content effectiveness across various formats, so every type of content has its own numbers.
To open insights for a specific post:
- Go to your Instagram profile and find a post.
- Tap the post to open it.
- Tap view insights directly under the image or video.
You’ll see likes, comments, shares, and saves, plus accounts reached and impressions. You can also see how people found the post – from the Home feed, Profile, Explore, hashtags, or through shares. This tells you where your content performs best.
For Reels, you’ll also see plays, how many new followers came from that Reel, and sometimes a skip rate showing how often people swiped away. Instagram added these more detailed metrics in recent updates.
For Stories, story insights include impressions, reach, taps forward, taps back, replies, and exits or swipe-aways. Live videos also have their own data – if you ever try Instagram Live videos, you’ll see viewer counts and interactions afterward.
Try comparing a few recent pieces of content – maybe three Reels from last month. You might discover that face-to-camera videos get more replies while photo carousels get more saves. You can view insights for all the posts in your feed this way, building a picture of your content’s performance over time.
Turning Instagram Data into a Simple Content Strategy
The goal isn’t to memorize every metric. It’s to use a few key numbers to gently guide future choices. Content performance metrics guide future content creation decisions, and insights help refine content strategy by identifying successful formats.
Here’s an easy monthly routine:
- Choose a date range such as “Last 30 days.”
- Note which 3–5 pieces of content brought the most accounts engaged.
- Note if reach went up or down compared to the previous month.
Think about “content pillars” – just 3–5 topics your audience loves. Maybe it’s “grandparent life,” “watercolor tutorials,” “memory lane photos,” and “daily walks.” Use Insights to see which pillars get the best engagement. Instagram Insights helps identify content that resonates with audiences, so let the numbers point you toward what people want more of.
If Reels about baking reached many non followers and had a high engagement rate, plan one baking Reel each week. If long text posts on a complex topic have low accounts engaged, try turning them into a short video or image carousel instead. Data-driven strategies improve content effectiveness on Instagram, even for hobby creators.
As a content creator, make small experiments rather than big overhauls. Change one thing at a time – time of day, topic, or format – and watch the next month’s Insights.
Using the Date Range and Content Library to Spot Trends
Insights is most useful when you look at patterns over time, not just yesterday’s numbers. Regularly reviewing insights can refine your content strategy month by month.
To adjust your view, tap the date at the top of the insights overview. You’ll see options for a longer preset timeframe like 90 days, or you can set a custom timeframe for any period you choose. Instagram Insights tracks total views and interactions over time, so these wider windows reveal overall trends more clearly.
Below the summary, the content library section shows all the posts, Reels, Stories, and live videos within your selected date range. You can sort by reach, likes, comments, or other interactions to find your top-performing posts. Some users also check ad insights here if they’ve ever chosen to boost content, or see ads delivered data – though for most hobby accounts, the organic numbers matter more.
A practical idea: for a 90-day lookback, sort posts by reach to view trends in what brought new eyes, and by interactions to see what sparked conversation. You can also compare against the previous month to view trends and spot what changed.
Keep it simple. Perhaps write down your top five posts each month in a notebook with short notes like “garden reel – many comments” or “family photo – most saves.” That’s your additional insights journal, and it works beautifully.

Common Questions and Gentle Troubleshooting
When reach or engagement drops suddenly, don’t panic. Instagram sometimes changes its algorithm, and seasonal changes or holidays affect activity. Compare the last 30 days versus the previous 30 days rather than worrying about one slow day. Check the insight names and numbers across a wider time frame before drawing conclusions.
“Do I have to post every day?” Not at all. A steady, realistic schedule of 2–3 times per week is plenty. Consistency matters more than volume, and your follower count will grow naturally when you post things people genuinely enjoy.
Comparing yourself to big accounts is tempting but misleading. Small creator accounts often have a better engagement rate than accounts with hundreds of thousands of followers – nano accounts under 10,000 followers average around 7%. Focus on meaningful conversations (comments, replies, messages) instead of chasing big numbers.
When to ignore certain metrics: for beginners and hobbyists, profile visits or link clicks may matter less than comments and saves. It’s perfectly fine to give more attention to the numbers that match your own goals – whether that’s keeping in touch with grandchildren or growing a knitting community. The number of followers matters far less than the quality of connection.
Approach your Insights with curiosity, not judgment. They’re there to help you enjoy sharing, not to make you feel behind.
Conclusion: Let Insights Support, Not Control, Your Time on Instagram
Instagram Insights is a friendly guide that shows what helps you connect with others – not a strict scoreboard. Remember the three core areas:
- The insights overview for the big picture.
- Accounts reached and accounts engaged for visibility and connection.
- Audience demographics and active times to understand who you’re talking to and when.
Pick one small habit to start with this month: check your Insights on the first day of each month, note your top performing posts, and plan a few posts based on what worked best. Your stories, hobbies, and life experience matter – Instagram analytics simply help those stories reach the people who will appreciate them most.
Frequently Asked Questions (FAQs)
Do I lose anything by switching to a professional account to see Insights?
No. Switching to a Creator or Business account is free and can be undone anytime through “Account type and tools.” You still use the Instagram app exactly the same way – you can post photos, Reels, and Stories, follow friends, and send messages. The main change is the addition of analytics through the professional dashboard, optional contact buttons, and access to professional tools. Your follower growth, existing posts, and messages all stay the same.
How often should I check my Instagram Insights?
A quick glance once a week is plenty, with a more careful look once a month using a 30-day or 90-day date range. Avoid checking every hour or drawing conclusions from one slow post – that only leads to unnecessary worry. Treat Insights like a monthly progress journal, not a daily report card. Over time, you’ll naturally start to see what your audience loves.
What is a “good” engagement rate for a small account?
Engagement rate is the percentage of people who interacted with a post out of those who saw it. Many small creators see engagement rates around 2% to 5%, which is genuinely good. Anything higher is a bonus. Deep comments and kind messages matter more than hitting a specific percentage, especially for personal or hobby accounts.
Can I see exactly who viewed or saved my posts?
Instagram does not show a list of who viewed or saved regular posts and Reels – it only shows total numbers for views and saves. For Stories, you can see who viewed while the Story is still active (within 24 hours), but not after it expires. This privacy design protects everyone while still letting you see overall interest in your content.
What should I do if my followers are mostly in a different country or time zone?
Use the audience demographics and active times sections in Insights to see where followers live and when they are most active. Try scheduling posts for times that suit the majority, even if that means posting earlier or later than you usually would. Experiment with a few different posting times over a month, then check the date range data afterward to see which times led to higher reach and accounts engaged. Small adjustments can make a meaningful difference.
Disclosure: Some of the links in this article may be affiliate links, which can provide compensation to us at no cost to you if you decide to purchase. This site is not intended to provide financial advice. You can read our affiliate disclosure in our privacy policy.

